Course contents
Delta, theta and vega add up
The Greeks you met one leg at a time in Options Basics add up across a position. The net delta, net theta and net vega of a combination tell you how it will behave as price, time and volatility change.
- Add the delta, theta and vega of several legs into a position's net Greeks
- Predict how a position reacts to a move, to a day passing, and to a change in implied volatility
- Recognise a long-volatility position from a short-volatility one
You put on the NIFTY bull call spread. The next morning NIFTY opens up 100 points, a real move in your favour, and you check your profit expecting a jump. It has barely budged. Nothing is broken. This is exactly how the position is supposed to behave before expiry, and the reason is that between entry and expiry, your profit and loss are governed not by the payoff diagram but by the Greeks, and the two legs' Greeks partly cancel each other.
In Options Basics you met the Greeks one option at a time. Delta is how much a premium moves when the underlying moves by one point. Theta is how much value the option loses each day just from time passing. Vega is how much the premium changes when implied volatility, the market's expected move, changes by one percentage point. The one new idea in this chapter is simple to state and does most of the work from here on: for a whole position, you add the Greeks across the legs. A leg you own contributes its Greek; a leg you sold contributes the opposite sign, because you are on the other side of it.
Net delta, why the 100 points did so little
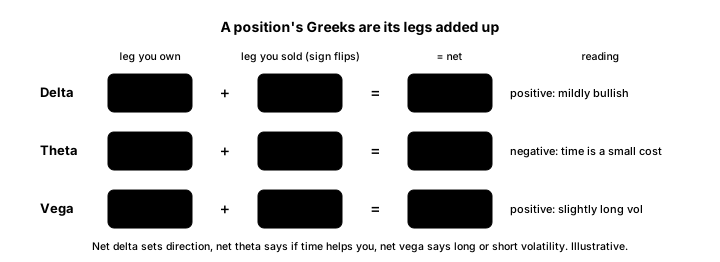
Give our spread some illustrative Greeks. The 24,000 call you own has a delta of about 0.50. The 24,200 call you sold has a delta of about 0.30. Because you are short the second one, it contributes minus 0.30. Add them: 0.50 minus 0.30 is a net delta of 0.20.
That number is the answer to your puzzle. A net delta of 0.20 means the whole spread moves like one-fifth of NIFTY. When NIFTY rose 100 points, your position gained roughly 20 points of value, not 100 and not the 50 a lone call would have gained. The leg you sold worked against the leg you bought, on purpose. That muting is the price you agreed to pay when you capped your upside, and now you can see it in a single number.
Net delta also tells you the position's direction in one glance. Positive net delta is bullish, the position wants the underlying up. Negative net delta is bearish. A net delta near zero is direction-neutral: the position barely cares which way the underlying goes, which, as the grid chapter promised, is the fingerprint of a volatility bet.
Net theta, is time your friend or your enemy
Do the same for theta. Say the call you own loses about 8 points a day to time, a theta of minus 8. The call you sold would lose about 5 points a day, but since you sold it, that decay is working for you, a plus 5. Add them: minus 8 plus 5 is a net theta of minus 3.
So this spread bleeds about 3 points a day if nothing else changes. That is a real cost, but notice it is far gentler than the minus 8 a lone long call would suffer. Selling the second leg did not just cut your cash outlay, it cut your daily bleed to time by more than half. That is one of the quiet reasons spreads are easier to hold than naked long options.
The sign is the thing to read. Net negative theta means time is your enemy, which is always true when you are a net buyer of premium. Net positive theta means time is your friend, which is true when you are a net seller. A credit spread, a short straddle, an iron condor: all carry positive theta, and they make money simply by the clock ticking, as long as the underlying behaves.
Net vega, are you long or short volatility
And once more for vega. The call you own has a vega of about 12, the call you sold about 9, and since you are short it, minus 9. Add them: 12 minus 9 is a net vega of plus 3.
A small positive net vega means the spread gains a little if implied volatility rises and loses a little if it falls. It is nearly volatility-neutral, which is typical of a vertical spread. But the sign of net vega is how you answer the second question of the grid. Positive net vega means you are long volatility: you profit if the market's expected move gets bigger. That is anyone who is a net buyer of options. Negative net vega means you are short volatility: you profit if the expected move shrinks, which is every net seller of options.
This is where the grid and the Greeks meet. A long straddle is strongly long vega and roughly delta-neutral: it wants a big move and rising volatility, direction be damned. A short straddle is its mirror, strongly short vega and delta-neutral: it wants calm and falling volatility. You do not have to be told a strategy's purpose if you can read its net vega.
The picture and the journey
Here is how this fits with the payoff diagram from the last two chapters. The payoff diagram is the destination: it shows where your profit and loss end up at expiry, and it is drawn with the Greeks all spent. The net Greeks describe the journey there. On any given day before expiry, your live profit is the payoff line softened and shifted by whatever delta, theta and vega have done since you entered. This is why a position can be right on direction and still show a loss today: net delta may be small, theta may be nibbling, or volatility may have dropped after an event and dragged a long-vega position down with it.
One honest caution. The Greeks are estimates, and they change as the underlying moves, as time passes, and as volatility shifts. Gamma, which you met briefly in Options Basics, is the rate at which delta itself changes, and near a strike close to expiry, delta can swing from almost nothing to almost one in a single fast move. So treat a Greek as a reading on a dial that is still turning, not a fixed promise. The signs stay reliable as a guide to character even when the exact figures do not.
What to carry forward
Add the legs' Greeks, flipping the sign for anything you sold, and you get the position's net delta, net theta and net vega. Net delta is your direction and its size is how strongly the position tracks the underlying. Net theta's sign says whether time pays you or bleeds you. Net vega's sign says whether you are long or short volatility, which is the grid's second question answered in one number. The payoff diagram is where you end up; the Greeks are how you travel. One piece of the toolkit remains, the part the diagrams and the Greeks both ignore: margin, costs, and liquidity, the real-world layer that decides whether a fine-looking strategy can actually be traded.