Course contents
The real-world layer
A payoff diagram assumes a frictionless world. In the real Indian market, sold legs tie up margin, every trade pays brokerage and taxes, and an illiquid strike quietly bleeds you on the spread. This chapter adds those back.
- Explain why selling options ties up margin and how a defined-risk spread cuts it
- List the real costs that shrink a strategy's payoff
- Choose liquid strikes and expiries and say why it matters
You find a short strangle that looks like free money: sell a call above the market and a put below it, collect 200 points, and pocket it if NIFTY just sits still for a week. You go to place it, and the broker asks you to set aside more than a lakh of rupees before it will let you in. When you finally exit, you notice you paid brokerage and taxes twice, once on each leg each way, and that you sold at a slightly worse price than the screen showed. None of this appeared on the payoff diagram. This chapter adds the real world back to the picture, because a strategy that is beautiful on paper and untradeable in practice is worth nothing.
Three forces separate the diagram from reality: margin, costs, and liquidity.
Margin, the price of selling
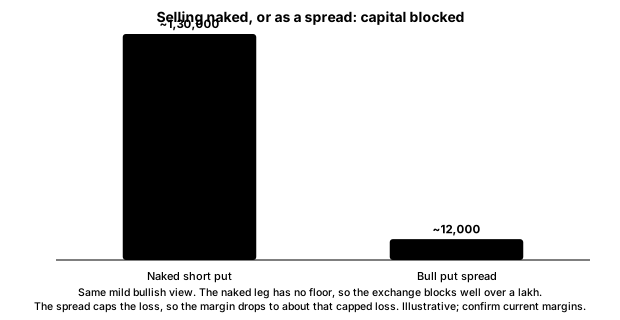
When you buy an option, you pay the premium and that is the end of it. Your risk is capped at what you paid, so the broker needs nothing more from you. When you sell an option, it is different. You have taken on an obligation that could cost you far more than the premium you collected, and the broker and the exchange need assurance you can pay if the trade goes against you. That assurance is margin, money blocked in your account for as long as the position is open.
In India the margin on a sold option comes in two parts. SPAN margin is the core, a risk-based amount the exchange calculates by imagining a range of bad moves in price and volatility and charging you for the worst of them. Exposure margin is an extra buffer stacked on top. Together they can be large. Selling a single naked NIFTY option can block well over a lakh of rupees, even though the premium you collected might be only a few thousand. (Margin figures are illustrative and change with exchange rules; confirm current requirements.)
Here is the lever that matters, and it is the reason spreads run through this whole course. A defined-risk spread requires far less margin than a naked sold leg. When you sell a put and also buy a further put below it, the exchange can see that your loss is capped at the width of the spread, so it no longer needs to charge you for a bottomless fall. Your margin drops to something close to that capped loss. Same bullish view, a fraction of the capital blocked, and a worst case you can name. The bought leg pays for itself many times over in freed-up margin.
Costs, the tax on every leg
The payoff diagram assumes trading is free. It is not. Every options trade in India pays a stack of charges: brokerage, exchange transaction fees, GST on those, stamp duty, SEBI charges, and securities transaction tax, or STT, the government's levy on the trade. Individually most are small. The trouble with strategies is that they multiply. A four-leg iron condor is eight trades, four to enter and four to exit, and each leg pays its share of the stack on the way in and again on the way out. A payoff that promised 120 points can quietly become 100 by the time the charges are counted.
STT carries one trap severe enough to keep for its own chapter later: it is charged very differently on an option you let expire in the money than on one you close before expiry. For now, just know that it exists and that closing a winning position rather than letting it run to settlement often saves money. The costs chapter near the end of the course works a full example.
There is also a cost that hides in plain sight, the bid-ask spread. At any moment an option has a slightly higher price to buy at and a slightly lower price to sell at, and the gap between them is money you lose the instant you trade, because you buy at the higher and sell at the lower. On a busy strike that gap might be half a point. On a neglected one it can be several points per leg, and across four legs it adds up before the market has moved at all. Whatever the gap does not take, slippage might, the difference between the price you expected and the price you actually got when your order filled.
Liquidity, whether the trade is even real
All of that assumes you can trade the strikes you want at sensible prices. You cannot always. Liquidity is how much buying and selling is actually happening in a given option, and it is wildly uneven. NIFTY and Bank Nifty weekly options near the current price are among the most liquid instruments in the country, trading constantly with tight bid-ask spreads. Go far out of the money, or out to a distant expiry, or into the options of a smaller single stock, and the crowd thins fast. Some strikes barely trade at all.
An illiquid strike hurts you three ways at once. The bid-ask spread widens, so entering and exiting costs more. Your order may not fill at all without chasing the price. And worst, when you most need to get out, in a fast move, there may be no one on the other side, and you are stuck holding a position you cannot close. In Options Basics you learned to read open interest and volume on the option chain. This is where you use that skill: build strategies from strikes that show real volume and open interest, and treat a thin strike as a wall, however tempting its premium looks.
Why the diagram lies a little
Put the three together and you can see exactly how the payoff diagram flatters a strategy. It assumes you can sell without blocking capital (ignoring margin), trade for free at a fair mid price (ignoring costs and the bid-ask spread), and always find a counterparty (ignoring liquidity). Reality shaves every edge. The honest way to use a payoff is to read it as the best case of the structure, then subtract costs and slippage from the profit, add a little to the true breakeven, and confirm the strikes are liquid enough to enter and exit. What survives that haircut is the trade you are actually considering.
To make the margin point concrete, compare two ways to take the same mild bullish NIFTY view. Sell a naked 24,000 put and you collect about 150 points, roughly 9,750 rupees, but you block well over a lakh in margin and your loss has no floor if NIFTY crashes. Run the bull put spread instead, selling the 24,000 put and buying the 23,800, and you collect only about 70 points, roughly 4,550 rupees, but you block margin close to the capped loss of 130 points, and you know that loss can never grow beyond it. You gave up some premium and bought back your worst case and most of your capital. For a beginner, that is almost always the better trade. (All figures illustrative.)
What to carry forward
The payoff diagram lives in a frictionless world; the real market charges you three ways. Selling ties up margin, and a defined-risk spread slashes that margin because the exchange can see the loss is capped. Costs and the bid-ask spread nibble every leg on the way in and out, so multi-leg trades pay more than you expect. And only liquid strikes are real, because an illiquid one you cannot enter or exit cleanly. That completes the toolkit: you can now say why to combine legs, read a view on the grid, read a payoff and its four numbers, derive those numbers by hand, read a position's net Greeks, and haircut it all for the real world. Part 2 puts the toolkit to work on the first family of strategies, the two ways to be bullish.