Course contents
The shape and its four numbers
A payoff diagram tells you almost everything about a strategy at a glance, the most you can make, the most you can lose, and where you break even. The strategy builder draws it for you before you trade.
- Read max profit, max loss, breakeven, and net premium off any payoff diagram
- Tell a net-debit structure from a net-credit one by its shape
- Use the strategy builder to see a position before risking money on it
Open Niota's strategy builder, add a single leg, and a picture appears: a bent line crossing from a red region into a green one, with a few numbers stacked beside it. That picture is a payoff diagram, and it is the fastest way to understand any strategy ever invented. You met it in Options Basics for a lone call and a lone put. Here you learn to read it for anything, because a four-leg monster and a single call are read exactly the same way.
What the picture shows
The horizontal axis is the price of the underlying at expiry, low on the left, high on the right. The vertical axis is your profit or loss. The bent line is the answer to one question asked at every possible price: if the underlying finishes here on expiry day, what do I make or lose? Where the line sits above the middle, you profit. Where it sits below, you lose. Where it crosses the middle, you break even.
That is the whole grammar. Everything else is reading four numbers off the shape.
The four numbers
Max profit is the highest the line ever reaches. Sometimes it is a flat ceiling, a number you can name. Sometimes the line just keeps rising off the top of the chart, and then max profit is unlimited, as it is for a lone long call.
Max loss is the lowest the line ever sinks. Again it is either a flat floor you can name, or an open drop with no bottom, which is the signature of an uncovered sold option and the thing this course keeps warning you about.
Breakeven is where the line crosses zero, the price the underlying must reach for you to come out even. A strategy can have one breakeven, or two, one on each side, and the two-breakeven shapes are the ones that bet on volatility.
Net premium is the cash that changes hands the moment you enter, before anything moves. Either you pay out, a net debit, or you collect, a net credit. This one number sets the mood of the whole trade.
Debit or credit, read from the shape
You can tell a debit structure from a credit one without being told which it is.
A net-debit structure is one you paid to put on. You start behind by the amount you paid, so near the current price the line sits in the red, and you need the underlying to move your way before you climb into profit. Buying tends to look like this. The reward for paying up front is that your loss is limited to what you paid, and your profit can be large.
A net-credit structure is one you were paid to put on. You start ahead by the amount you collected, so across a wide middle band the line sits at a flat profit, and you keep that profit as long as the underlying does not travel into your danger zone. Selling tends to look like this. The price of collecting up front is that your profit is capped at the credit, while your loss, unless you have capped it with another leg, can be much larger than what you took in.
So a shape that is flat-then-climbing, starting in the red, is usually something you bought. A shape that is a flat green plateau in the middle, dropping off at the edges, is usually something you sold. Once you see it this way, a glance at the diagram tells you whether time is likely working for you or against you, before you read a single Greek.
Reading our NIFTY spread
Take the bull call spread from the first chapter: buy the NIFTY 24,000 call at 150, sell the 24,200 call at 70, for a net debit of 80 points. Build it in the strategy builder and here is the shape it draws.
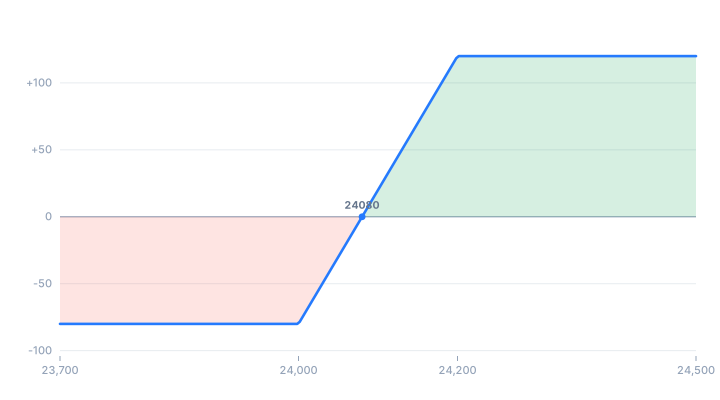
Below 24,000, both calls are worthless and the line sits flat on its floor: you lose your 80 points, the net debit, and no more. That flat floor is your max loss. Between 24,000 and 24,200 the line rises steadily as your bought call gains value. It crosses zero at 24,080, which is your breakeven, the lower strike plus the 80 you paid. Above 24,200 the line flattens again into a ceiling: the call you sold now rises point for point against the call you own, so your profit stops at 120 points, your max profit. Four numbers, one shape, the whole trade.
Notice the line starts in the red near 24,000. That is the debit telling you honestly that you paid to be here and need a move to profit. Notice too that both ends are flat and finite: this is a defined-risk trade, and you could write down its worst case before entering. The next chapter shows exactly where each of those four numbers comes from, in arithmetic, so the builder never shows you a figure you cannot check.
Where the picture stops telling the whole truth
Two honest cautions. First, the payoff diagram is drawn for expiry day. Before expiry, your profit and loss follow a softer, curved version of the same line, because time value has not yet drained away, which is the difference between expiry payoff and live profit you met in Options Basics. The bent line is the destination, not the daily route. Second, the diagram is drawn in a costless world, with no brokerage, no taxes, and instant fills at a fair price. Real costs shift your true breakeven a little further away. You will add the route in the Greeks chapter and the costs in the real-world chapter.
What to carry forward
Any strategy, however many legs, is read the same way: price at expiry across the bottom, profit and loss up the side, and four numbers off the shape, max profit, max loss, breakeven, and the net premium you paid or collected. A shape that starts in the red and climbs was bought (a debit); a flat green plateau that drops at the edges was sold (a credit). Build every trade in the strategy builder and read those four numbers before you commit. Next, you will derive them by hand for a spread, so the picture rests on arithmetic you trust.