Course contents
What indicators are
An indicator is a calculation on price or volume, drawn as a line or histogram. It repackages what price already shows, most indicators lag, and more of them usually means more noise, not more insight.
- Define an indicator
- Distinguish lagging from leading indicators
- Understand why loading a chart with many indicators backfires
Open any charting app and you find hundreds of indicators, and it is tempting to pile them on until the chart is a rainbow of lines. Understand what an indicator actually is, though, and you will reach for a few good ones instead of many useless ones.
An indicator is a calculation on price
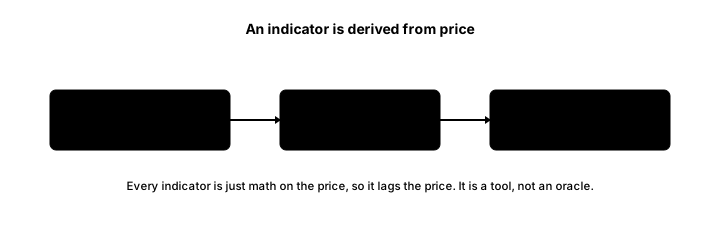
An indicator is a calculation performed on price, or on volume, and drawn as a line or a histogram on or beneath the chart. That is all it is. It takes information the price already contains and repackages it into a form that is easier to read. A moving average, for instance, is just the average of recent closing prices drawn as a smooth line. The key consequence is simple: an indicator is derived from price, so it can never know more than price does.
Lagging and leading
Most indicators are lagging. They are built from past prices, so they confirm a move after it has begun, the way a moving average only turns up once price has already been rising for a while. A few are described as leading, meaning they try to anticipate a turn, like an oscillator flagging that a move has stretched too far. But even these are only arithmetic on past prices, so treat the word leading with suspicion. Nothing derived from price genuinely predicts the future.
The overload trap
Adding more indicators feels like gathering more information, but it usually just adds noise and false confidence. The reason is that many indicators measure the same thing. Three momentum indicators all flashing the same signal is not three confirmations, it is one signal repeated, and it fools you into feeling sure. A lean set, with each indicator measuring something genuinely different, trend, momentum, volatility, volume, tells you far more than ten that all measure trend.
What to carry forward
An indicator is nothing more than a calculation on price or volume, drawn as a line or histogram, and because it is derived from price it can never know more than price already does. Most indicators lag, confirming moves after they start, and the ones sold as leading are still only maths on the past. Piling on more indicators adds noise and false confidence, especially when they measure the same thing, so the skill is to use a lean set of complementary tools that confirm price and context, never to replace them.
The most useful and most honest indicator of all comes first. The next chapter is about moving averages.