Course contents
Bollinger Bands and volatility
Bollinger Bands wrap price in a band around a moving average that widens with volatility and narrows when calm. A squeeze often precedes a big move, and a touch of the band is stretch, not a reversal signal.
- Explain Bollinger Bands and what widening and narrowing mean
- Mention ATR as a volatility measure
- Warn against reading a touch of the band as a signal
The indicators so far track direction and momentum. Bollinger Bands track something different: volatility, how stretched or how calm price is right now. They do it by wrapping the price in a band that breathes, widening and narrowing as the market gets wild or quiet.
What the bands are
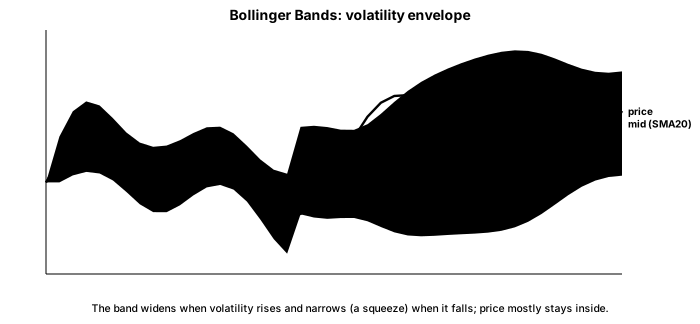
Bollinger Bands are three lines. The middle is usually a twenty-period moving average. The upper and lower bands sit a couple of standard deviations above and below it, where standard deviation is just a measure of how spread out recent prices have been. When prices swing widely, the bands stretch apart; when prices go quiet, the bands squeeze together. The width of the band is a live picture of volatility.
Reading them
Wide bands mean high volatility, a market making big moves. Narrow bands mean low volatility, a calm, coiling market. A very tight band, often called a squeeze, tends to come before a big move, as volatility that has compressed eventually expands again. Note the honest limit: a squeeze warns that a move is coming, but it does not tell you which way.
Price near the upper band is stretched to the upside, and near the lower band, stretched to the downside. But, exactly like RSI's overbought reading, a touch of the band is not a reversal signal. In a strong uptrend, price can ride the upper band for days, and a trader who shorts every band touch is repeatedly run over. In a range, price does tend to travel between the bands; in a trend, it hugs one of them.
There is a related volatility measure worth naming: the Average True Range, or ATR, which gauges how much a stock typically moves in a period. It is handy for setting stops, since a stop placed a multiple of ATR away adapts to how volatile the stock actually is, a point the trading-plan chapter returns to.
What to carry forward
Bollinger Bands turn volatility into something you can see, wrapping price in a band that widens when moves are large and narrows when the market is calm. A squeeze warns that a move is brewing, though not its direction, and the width itself is the reading. The trap to avoid is treating a band touch as a reversal signal, because in a trend price rides the band happily. Paired with ATR for judging how far a stock normally travels, the bands measure the market's energy rather than its direction.
One family of indicators remains, the ones built on volume. The next chapter covers them.