Course contents
Patterns in context
A pattern means little on its own. It earns weight only with confluence: the trend behind it, a level at it, and volume confirming it. Even then it only shifts the odds. The edge is context plus risk management, not the shape.
- Explain confluence of trend, level, and volume
- Show the same pattern meaning different things in different contexts
- Set honest expectations about pattern reliability
After five chapters of patterns, this is the most important one, because it is the reality check the others have been building toward. A pattern on its own means almost nothing. Patterns earn their weight only from the context around them, and even then they only shift the odds a little. This chapter is what separates a disciplined chart-reader from someone chasing shapes.
Confluence: three filters
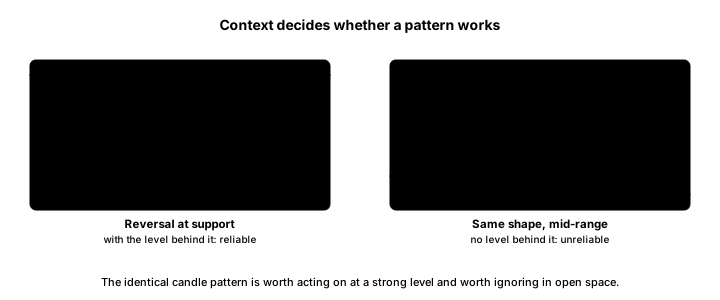
A pattern is worth acting on when several things line up, which traders call confluence.
The first filter is trend. A bullish pattern that agrees with the trend, appearing in an uptrend or at a bottom after a clear downtrend, is far stronger than one fighting the trend. Aligned with the trend beats counter-trend, every time.
The second filter is the level. A pattern that forms at a meaningful support or resistance level means far more than the same pattern in the middle of nowhere. A hammer at established support is worth attention; a hammer floating mid-range is not.
The third filter is volume. A pattern or breakout confirmed by strong volume is far more trustworthy than one on a trickle.
When trend, level, and volume agree, the odds genuinely improve. When a pattern has none of them behind it, it is noise dressed up as a signal.
The human problem: we see patterns everywhere
Our brains are pattern-finding machines, and they find patterns even in randomness. You can spot a head and shoulders on almost any chart if you want to badly enough. This is why the internet is full of screenshots of perfect patterns that worked: the ones that failed are quietly left out, and the survivors look like proof. Be deeply skeptical of any pattern shown without its context and without its failures.
What to carry forward
This is the honest heart of chart patterns. On its own, a pattern is close to meaningless, and it becomes useful only when the trend, a real level, and volume line up behind it, which traders call confluence. Even then it does no more than tilt the odds, and our natural habit of seeing patterns everywhere, reinforced by screenshots that hide the failures, makes them look far more reliable than they are. Master a few patterns, always read them in context, and remember that your edge lives in confluence and in managing risk, not in the shape.
That completes chart patterns. The next part turns to indicators, the calculations drawn from price and volume, taught honestly for what they are and what they are not.