Course contents
RSI and momentum
RSI is a 0 to 100 momentum meter. Above 70 is overbought and below 30 oversold, but these mean the move is strong, not that it must reverse. Its more useful signal is divergence, where price and RSI disagree.
- Explain RSI in plain terms
- Read overbought and oversold honestly
- Explain divergence and why overbought can stay overbought
A moving average shows the direction of a move. Sometimes you want to know its strength: is the rise powering ahead, or running out of breath. The Relative Strength Index, almost always called RSI, is the common way to measure that momentum.
What RSI measures
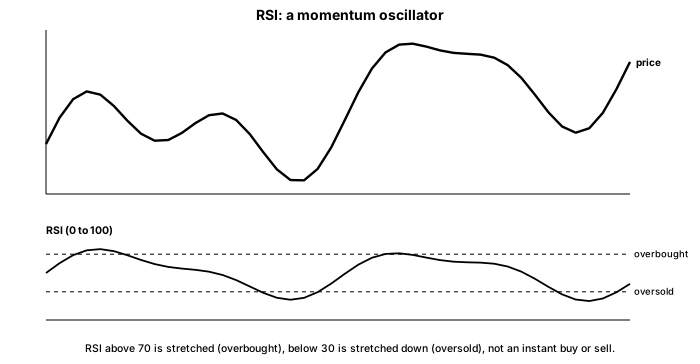
RSI is an oscillator that runs between 0 and 100 and measures the speed and size of recent price moves. A high reading means recent gains have been strong and fast, a low reading means recent losses have been. By convention, a reading above 70 is called overbought and one below 30 oversold. You do not need the formula. Read it as a momentum meter: how hard, and how one-sided, the recent push has been.
Overbought does not mean sell
Here is the misreading that costs beginners the most. Overbought does not mean sell now, and oversold does not mean buy now. Overbought means only that the recent rise has been strong. In a sustained uptrend, RSI can sit above 70 for a long time while price keeps climbing, and traders who short simply because RSI is high get run over again and again. RSI extremes are a sign of stretch, not a signal to reverse.
Divergence, the more useful reading
RSI earns its keep in a subtler way, through divergence, when price and RSI disagree. If price grinds to a new high but RSI makes a lower high than it did on the previous peak, momentum is weakening even as price still rises, a warning the move is tiring. This is the same idea as the falling-volume warning from the volume chapter, now measured. Bullish divergence is the mirror: price makes a new low but RSI makes a higher low, hinting the fall is losing force.
What to carry forward
RSI measures the strength and speed of recent moves on a 0 to 100 scale, with overbought above 70 and oversold below 30. The crucial honesty is that those extremes signal a strong move, not an imminent reversal, and in trends they can persist far longer than a beginner expects. RSI's more dependable use is divergence, where price makes a new extreme that RSI does not, warning that the momentum behind the move is quietly draining away. Read always in the context of the trend.
The next chapter meets an indicator that folds trend and momentum into one: MACD.