Course contents
MACD
MACD combines two moving averages into a MACD line, a signal line, and a histogram, showing trend and momentum together. A crossover is its main lagging signal, the histogram hints earlier, and divergence warns of fading momentum.
- Explain the MACD line, signal line, and histogram
- Read a MACD crossover
- Understand that it lags like all moving averages
The MACD is one of the most popular indicators because it packs two ideas into one: the direction of the trend and the momentum behind it. Its name, Moving Average Convergence Divergence, sounds forbidding, but the picture it draws is straightforward once you know its three parts.
The three parts
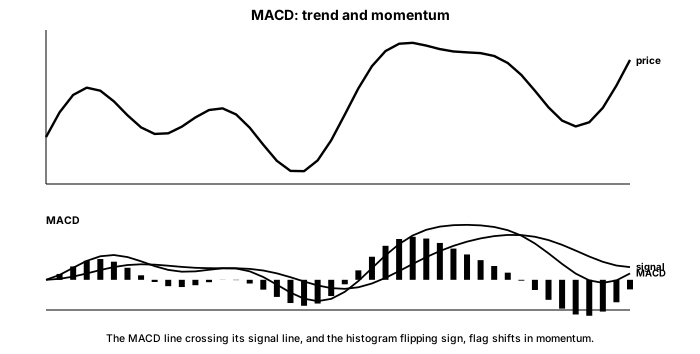
MACD is built from two exponential moving averages of price, a shorter and a longer one. From them come three pieces you actually read.
The MACD line is the shorter average minus the longer one. When it is positive, short-term momentum is running ahead of the longer trend; when negative, it is lagging behind. The signal line is a moving average of the MACD line itself, a smoother version that trails it. The histogram is the gap between the two, drawn as bars, and it grows and shrinks as they pull apart and come together. You do not need to calculate any of this, only to read the three moving pieces.
Reading it
The main signal is a crossover. When the MACD line crosses above its signal line, momentum is shifting up, a bullish sign. When it crosses below, momentum is shifting down. The histogram gives an earlier hint: it starts shrinking before the lines actually cross, so a fading histogram warns that momentum is slowing while price may still be moving. And like RSI, MACD can diverge from price, a new price high with a lower MACD high warning that the move is tiring.
What to carry forward
MACD folds trend and momentum into one indicator through three pieces: the MACD line, the difference between a short and a long average, the signal line that smooths it, and the histogram that shows the gap between them. Its crossovers are its headline signal but they lag, its histogram offers an earlier hint of momentum fading, and its divergence from price is a useful warning. Because it is made of moving averages, it shares their weakness of lagging and whipsawing in trendless markets, so it belongs in the confirmation role, not the predicting one.
Direction and momentum are covered. The next chapter measures something different, how stretched or calm the market is, with Bollinger Bands.