Course contents
Support and resistance
Support is a level where buyers repeatedly step in, resistance where sellers do. They form from collective memory, a broken level swaps roles, and they are zones for making decisions and placing stops, not exact walls.
- Define support and resistance
- Explain why levels form and why a broken level swaps roles
- Use levels as zones to decide and to place stops
The single most useful idea in all of charting is not a clever indicator or an exotic pattern. It is a pair of horizontal lines: the price levels where buyers and sellers have repeatedly shown up. They are called support and resistance, and much of technical analysis is really just the study of them.
Floors and ceilings
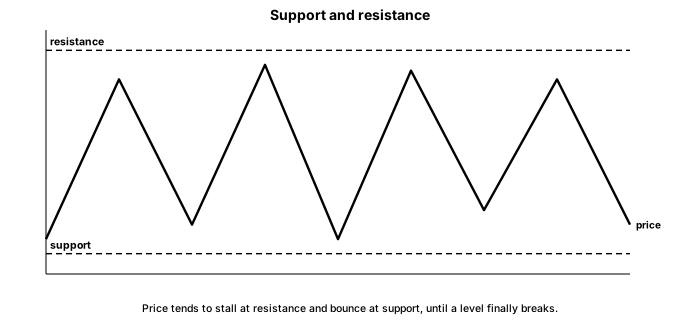
Support is a price level where buying has repeatedly appeared and halted falls, acting like a floor under the price. Each time the stock drops to it, demand shows up and pushes it back.
Resistance is the opposite, a level where selling has repeatedly appeared and halted rises, acting like a ceiling. Each time the stock climbs to it, supply shows up and knocks it back.
A stock caught between the two, bouncing off support and stalling at resistance, is in the range from the trend chapter, and the two levels are its floor and its ceiling.
Why levels form
Levels are collective memory, which is the first chapter's crowd behaviour made visible. Round numbers draw attention, so prices like 1,500 or 25,000 often act as levels simply because so many people watch them. Prior highs and lows matter because people remember them: those who missed a bounce off a level wait to buy the next time price returns to it, and those who bought at a high and got trapped wait to sell at break-even when price climbs back. Both kinds of memory cluster orders at the same prices, and that clustering is what makes the level hold.
Broken levels swap roles
Here is the insight that makes levels so useful. When a support level finally breaks, it tends to become resistance, and a broken resistance tends to become support. The reason is human. Once a floor gives way, the people who bought there are now sitting on losses, and many of them sell into any bounce back to that price just to get out even, which caps the price at the old floor, now a ceiling. Watching a level flip roles is one of the more reliable things on a chart.
Using levels
Levels are where you make decisions. You look to buy near support in an uptrend, you watch resistance as a place a rally may stall, and, most importantly, you place your stop just beyond a level, because if the level breaks, the reason for your trade is gone. This is the honest heart of it: support and resistance are less a way to predict and more a way to define, cleanly, where you are right and where you are wrong.
What to carry forward
Support and resistance are the horizontal levels where buyers and sellers have repeatedly appeared, a floor and a ceiling built from the market's collective memory and its fondness for round numbers. Their most useful trick is role reversal: a broken support becomes resistance, and a broken resistance becomes support, because of how trapped traders behave. Treat them as zones rather than exact lines, use them to decide and to place stops, and never forget that every level eventually breaks.
What happens at the moment a level breaks is its own subject, full of both opportunity and traps. The next chapter is about breakouts and the false breakouts that catch the crowd.