Course contents
Trendlines and channels
A trendline connects the swing lows of an uptrend as rising support, or the highs of a downtrend as falling resistance. A parallel line makes a channel. A decisive close through the line warns the trend may be changing.
- Draw a trendline and a channel
- Explain what a break of the line suggests
- Draw lines honestly rather than forcing them onto noise
A trend is an idea. A trendline turns that idea into a line on the chart you can actually use, marking where the trend has been respected and where its break would tell you something changed.
Drawing the trend
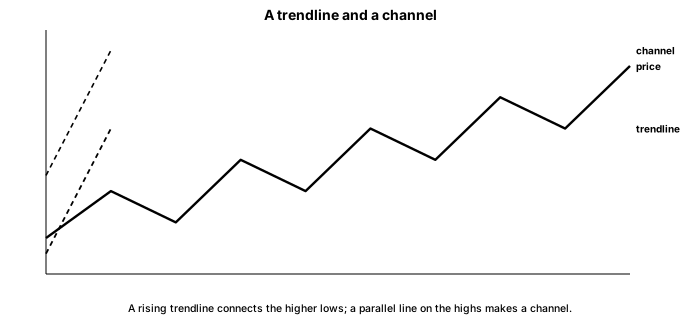
A trendline is a straight line drawn along the edge of a trend. In an uptrend, you draw it under the rising swing lows, where it acts as a rising floor, a support the price keeps bouncing from. In a downtrend, you draw it across the falling swing highs, where it acts as a falling ceiling, a resistance the price keeps failing at.
A line needs two points to draw and a third touch to trust. Two swing lows give you a candidate up-trendline, and a third bounce from it confirms the line is real and not a coincidence. The more times price respects a line without breaking it, the more meaningful it is.
Draw them honestly
Trendlines are partly a matter of judgment, and that is where beginners go wrong. Connect the obvious swing points, and do not force a line through the middle of noise or cherry-pick the two points that flatter the story you already believe. Drawing along the closes rather than chasing every wick usually gives a cleaner, more honest line. If you find yourself redrawing a line three times to keep a trade alive, the line is telling you something you do not want to hear.
Channels
Draw a second line parallel to the trendline, along the opposite swing points, and you have a channel. In an uptrend, a line under the lows and a parallel line across the highs frame a rising corridor that price often travels within, bouncing from the lower line and stalling at the upper one. A channel gives you both a place to look for entries, near the lower line in an uptrend, and a sense of where a move may stall.
When the line breaks
When price closes decisively through a trendline, ideally on heavy volume, it warns that the trend may be pausing or turning. Notice the word closes: a wick poking through the line intraday is not the same as a close beyond it, a distinction the breakout chapter treats in full. A break is a warning and a place to reassess, not an automatic reversal.
What to carry forward
A trendline draws the trend as a line you can act on: under the lows in an uptrend as rising support, across the highs in a downtrend as falling resistance, valid once price has touched and respected it a few times. A parallel line turns it into a channel that frames the move. A decisive close through the line, on volume, is a warning to reassess. Drawn honestly and held as guides rather than rails, trendlines mark where a trend lives and where its break would matter.
Trendlines slope with the trend. The next chapter covers the levels that sit flat and are, for many traders, the most useful marks on the chart: support and resistance.