Course contents
Candlestick anatomy
A candlestick shows the open, high, low, and close of its period. The body is the open-to-close range, up or down by which way price finished, and the wicks show the extremes that were reached and rejected.
- Define open, high, low, close, body, and wick
- Read a bullish and a bearish candle
- Explain what long wicks suggest
A single candlestick looks like a small coloured brick with threads sticking out of it. Inside that shape are four prices and a short story about one period's tug-of-war between buyers and sellers. Learn to read one candle and every chart opens up.
Four prices in one shape
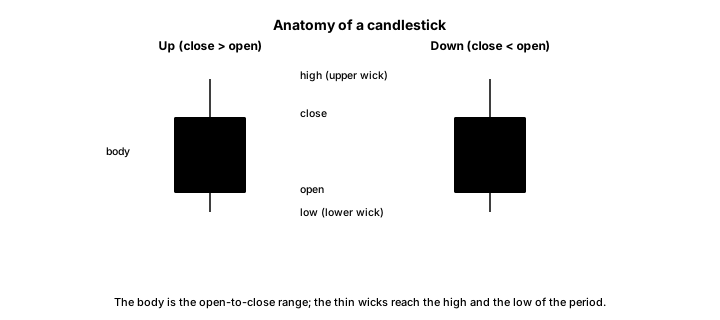
A candlestick packs the four prices of its period. The open is the first traded price, the close is the last, and the high and low are the highest and lowest reached in between.
These are drawn as two parts. The body is the thick block between the open and the close. The wicks, also called shadows, are the thin lines above and below the body, reaching up to the high and down to the low. So the body shows where price began and ended, and the wicks show how far it strayed in each direction along the way.
Which side won
The colour of the body tells you who won the period. If the close is above the open, price rose over the period and the candle is an up candle, drawn light or green by convention: buyers had the upper hand. If the close is below the open, price fell and the candle is a down candle, drawn dark or red: sellers had it. The length of the body shows how decisively, a long body marking a one-sided period and a short body a near-draw.
What the wicks reveal
The wicks are where the story gets interesting, because they show prices that were reached and then rejected. A long upper wick means price pushed up during the period but was sold back down before the close: buyers tried, sellers refused the higher prices. A long lower wick means price fell but was bought back up: sellers tried, buyers stepped in. A candle with a small body and a long lower wick, appearing after a fall, hints that sellers lost control and buyers arrived, which is the seed of a pattern a later chapter names.
What to carry forward
One candlestick holds four prices and a small story. Its body spans the open and the close, coloured up or down by which way price finished, and its length shows how decisive the period was. Its wicks reach to the high and the low and reveal where price was rejected, a long upper wick showing sellers pushing back and a long lower wick showing buyers stepping in. It is a single period's tale, best read alongside its neighbours and its trend rather than alone.
Which raises the question the next chapter answers: what counts as a period at all. That is the timeframe, and it changes everything you see.