Course contents
Turning prices into performance
A price on its own says little; what matters is the return, the percentage change, and the cumulative return that compounds many of them into a total. These are the first real measures of performance, computed in a line of pandas.
- Compute daily percentage returns from a price series
- Compound them into a cumulative return
- Interpret the difference between a simple and a cumulative return
Now that you can load, clean, and handle real prices, Part 4 turns them into the numbers a trader actually looks at, starting with the most basic: performance. A raw price, 1417 today, says almost nothing on its own. What matters is how it changed: the return. This chapter computes daily returns and then compounds them into a cumulative return, the total performance over a stretch, both in a line or two of pandas.
Daily and cumulative returns
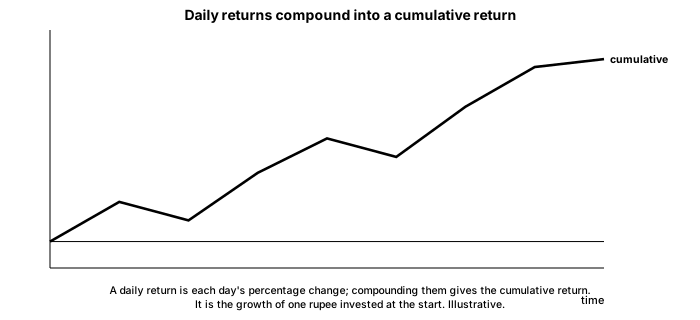
You met pct_change already; here it does the central job, and a second line compounds the daily returns into a running total.
# Turn prices into returns, and compound them into a total.
import pandas as pd

df = pd.read_csv("sample_prices.csv", parse_dates=["Date"], index_col="Date")

df["daily_return"] = df["Close"].pct_change()
df["cumulative"] = (1 + df["daily_return"]).cumprod() - 1   # compound the daily returns

total = df["cumulative"].iloc[-1] * 100
print(f"First close: {df['Close'].iloc[0]:.2f}")
print(f"Last close:  {df['Close'].iloc[-1]:.2f}")
print(f"Total return over the period: {total:.2f}%")
print(f"Average daily return: {df['daily_return'].mean() * 100:.3f}%")
print(f"Best day: {df['daily_return'].max() * 100:.2f}% Worst day: {df['daily_return'].min() * 100:.2f}%")First close: 1408.90 Last close: 1417.68 Total return over the period: 0.62% Average daily return: 0.010% Best day: 3.30% Worst day: -3.10%
The first computed column is the daily return, the percentage change of the close from one day to the next. The second, (1 + daily_return).cumprod() - 1, compounds those daily returns into the cumulative return, the total performance from the start up to each day, by multiplying together one-plus-each-return. The output reports the whole period at a glance: the close went from 1408.90 to 1417.68, a total return of 0.62%, with an average daily return of just 0.010%, a best day of plus 3.30%, and a worst of minus 3.10%.
What the numbers reveal
Read those figures together, because they teach something important about markets. The total return over the whole period was a slim 0.62%, and the average day moved just 0.010%, yet individual days swung by more than three percent in both directions. This sample rose only slightly overall, but it did so through large daily ups and downs, in fact falling well below its start before recovering. Daily noise is large; long-run drift can be small. A trader who watches the daily swings feels enormous movement, while the investor who looks only at the endpoints sees a nearly flat period. Both are true, and returns are how you measure each.
Notice too that the cumulative return computed by compounding equals what you would get from the simple endpoints, the last close divided by the first, minus one, because compounding the daily returns is exactly that calculation done step by step. That is worth seeing once: a total return is not a sum of daily returns but a product of them, which is why a stock that falls 10% then rises 10% is not back to even, the same asymmetry the Risk and Psychology course drew, now falling straight out of the arithmetic.
What to carry forward
Prices become performance through returns: pct_change gives the daily percentage change, and compounding those with cumprod gives the cumulative return, which matches the endpoints because a total return is a product of daily returns, not a sum. The sample's slim 0.62% total against three-percent daily swings shows that daily noise dwarfs long-run drift, and the multiply-not-add nature explains the loss-recovery asymmetry from Risk and Psychology.
A raw return series is noisy. The next chapter smooths it into a trend with the moving average, the most common derived series in all of trading.