Course contents
Working with the calendar
Market data is a time series, indexed by date, and pandas has special tools for it, parsing dates, sorting by time, and resampling daily data to weekly or monthly. Handling time correctly is essential and easy to get wrong.
- Work with a datetime index and sort by date
- Resample a price series to a lower frequency
- Select data by date range
Market data is not just a table; it is a table ordered by time, and that time dimension is central to almost everything a trader computes. A return is a change from one date to the next; a monthly summary groups days into months; a study of a period selects a date range. pandas has a set of tools made specifically for this, and using them correctly is essential, because time is also one of the easiest things to get subtly wrong. You have already been using a date index; this chapter puts it to work.
The date index at work
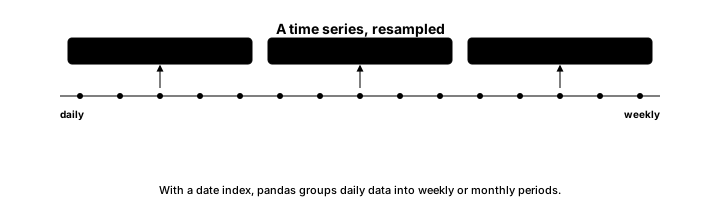
Because you loaded the data with the Date column parsed as real dates and set as the index, pandas knows the table is a time series and enables time-aware operations. This program resamples the daily closes to monthly and selects a single month.
# A date index lets you resample and slice by time.
import pandas as pd

df = pd.read_csv("sample_prices.csv", parse_dates=["Date"], index_col="Date")

monthly = df["Close"].resample("ME").last()   # last close of each month
print("Monthly closing prices:")
print(monthly.round(2))

jan = df.loc["2024-01"]                        # select by date range
print("January rows:", len(jan))Monthly closing prices: Date 2024-01-31 1375.47 2024-02-29 1287.03 2024-03-31 1247.86 2024-04-30 1290.74 2024-05-31 1275.71 2024-06-30 1316.04 2024-07-31 1269.82 2024-08-31 1337.47 2024-09-30 1417.68 Freq: ME, Name: Close, dtype: float64 January rows: 23
The key operation is resample("ME").last(), which groups the daily data into calendar months (ME meaning month-end) and takes the last close of each, turning 180 daily prices into 9 monthly closing prices, one per month from January to September. Resampling is how you move between frequencies, daily to weekly, monthly, or yearly, and .last() is one choice of how to summarise each group; you might instead take the mean, the first, or the high. The final line, df.loc["2024-01"], selects every row in January simply by naming the month, and reports 23 trading days in it. Naming a date or a month to select a slice is one of the quiet conveniences a proper date index gives you.
Why time needs care
Time rewards care and punishes carelessness in specific ways worth flagging now. Data must be sorted by date for time operations to make sense, and real data sometimes arrives out of order, so sorting the index is a sensible first step. Frequencies must not be mixed carelessly: comparing a daily return to a monthly one, or lining up two series recorded on different days, produces nonsense that no error message will warn you about. And market time has gaps by design, since exchanges close on weekends and holidays, so a "30-day" window is not the same as a calendar month, and resampling handles that correctly where naive counting does not.
The reassuring part is that pandas does the hard work once the index is a proper datetime index. Resampling respects the real calendar, date selection understands months and years, and alignment between two dated series is handled for you. The discipline on your side is simply to make sure the dates really are dates, not text, which the loading chapter's parse_dates ensured, and to keep in mind which frequency you are working at. Get that right, and the calendar becomes an ally rather than a trap.
What to carry forward
Market data is a time series, and a proper datetime index lets pandas resample between frequencies (daily to monthly with resample), select by naming a date or month, and align dated series correctly, all while respecting the real calendar's weekends and holidays. Your job is to ensure dates are truly dates and to stay aware of which frequency you are working at.
That completes Part 3: you can now bring in the tools, load and fetch real data, clean it, question it, and handle its dates. Part 4 turns these skills on prices themselves, computing the returns, moving averages, and volatility that a trader actually looks at, and drawing the charts that show them.