Course contents
Smoothing the noise
A moving average smooths a noisy price into a trend by averaging a rolling window, and pandas computes it in one call. It is the simplest and most common derived series, and the basis of many signals.
- Compute a simple moving average with a rolling window
- Compute more than one window length
- Explain what a moving average does and hides
The last chapter showed how noisy a daily price is, swinging several percent a day while drifting slowly overall. To see the trend underneath that noise, traders smooth the price, and the simplest smoother is the moving average: the average of the last so-many days, recomputed each day as the window slides forward. It is the most common derived series in all of technical work, the basis of many signals, and pandas computes it in a single call.
A rolling window
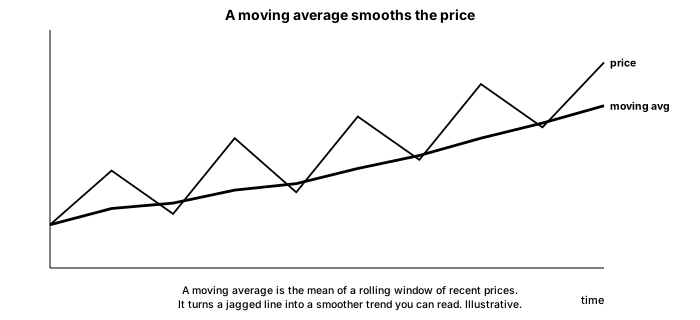
The tool is rolling, which forms a sliding window over the series, and .mean, which averages each window. This program computes a short and a long moving average of the close.
# A moving average smooths a noisy price with a rolling window.
import pandas as pd

df = pd.read_csv("sample_prices.csv", parse_dates=["Date"], index_col="Date")

df["sma_20"] = df["Close"].rolling(20).mean()   # 20-day simple moving average
df["sma_50"] = df["Close"].rolling(50).mean()   # 50-day simple moving average

print(df[["Close", "sma_20", "sma_50"]].tail(3).round(2))
above = int((df["Close"] > df["sma_20"]).sum())
print(f"Days the close was above its 20-day average: {above} of {len(df)}")Close sma_20 sma_50 Date 2024-09-04 1376.16 1329.54 1301.95 2024-09-05 1372.34 1333.81 1302.93 2024-09-06 1417.68 1339.80 1304.96 Days the close was above its 20-day average: 72 of 180
df["Close"].rolling(20).mean() takes, for each day, the average of that day and the previous nineteen, a 20-day simple moving average, and the 50-day version does the same over a longer window. The output's last three rows show the close well above both averages, with the 20-day average above the 50-day, the picture of a recent rise. The final line counts that the close finished above its 20-day average on 72 of the 180 days. A shorter window hugs the price and turns quickly; a longer window is smoother and slower, which is why traders watch more than one.
What it shows, and what it hides
A moving average does two things at once, and you should hold both in mind. It reveals the trend by averaging away the day-to-day noise, so a rising average signals a genuine upward drift rather than a single good day. But it also lags, because it is built from past prices: by the time a 50-day average turns, the price has been moving for a while, so an average tells you where the price has been more than where it is going. The longer the window, the smoother and the more lagging. There is no single right length; a short average is responsive but noisy, a long one is stable but slow, and the choice depends on what you are trying to see.
One practical detail from the output: the first values of a rolling average are missing, because a 20-day average needs 20 days before it can be computed, so the early rows are blank until the window fills. That is normal and expected, and it is why you compute averages on a series long enough to spare the warm-up period.
Moving averages matter for this course beyond smoothing, because the crossover of a short and a long average is the classic beginner strategy you will build and test in Part 5. Everything there rests on the one call you just met.
What to carry forward
A moving average is the rolling mean of the last n days, computed with rolling(n).mean(), and it smooths noise into a visible trend at the cost of lagging behind the price, more so the longer the window. Its first values are blank while the window fills. Watching a short and a long average together is the basis of the crossover strategy you will build in Part 5.
Trend is one thing a price series reveals; how violently it moves is another. The next chapter measures that swing as volatility, the quantitative face of the risk from the Risk and Psychology course.