Course contents
Getting live and historical prices
Beyond files, you can fetch real market data programmatically, historical OHLCV for an Indian stock or index, so your analysis runs on genuine prices. This chapter pulls real data in, through a broker's SDK or an open library.
- Fetch historical OHLCV data for an Indian instrument
- Understand the shape of the data returned
- Handle the practicalities of a data source (rate limits, gaps)
Loading a saved file is fine, but you usually want prices on demand: give a symbol and a date range, and get the data back, fresh, without hunting for a file. That is fetching data programmatically, and it is how a real analysis stays current. For Indian market data there are two routes worth knowing, and both hand you the same OHLCV table, open, high, low, close, and volume, that you have been working with.
Route one: your broker's SDK
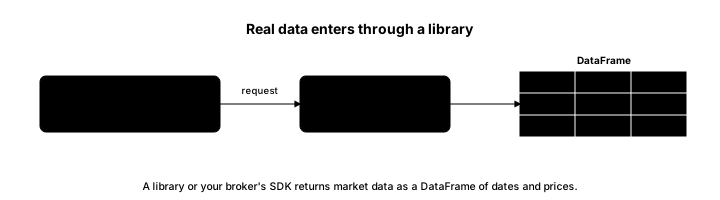
The route to prefer, once you have a trading account, is your broker's official Python SDK, the library your broker provides to access its data and, later, to place orders. It gives authenticated access to genuine Indian market data, historical and current, straight from the source you trade through. Every broker's SDK differs in its exact names, so treat the following as the shape of it rather than a specific recipe, and follow your own broker's documentation.
# Preferred: your broker's official Python SDK (details vary by broker).
from your_broker_sdk import Client            # the SDK you installed

client = Client(api_key="YOUR_KEY", access_token="YOUR_TOKEN")
df = client.historical_data(
    symbol="RELIANCE", exchange="NSE",
    start="2024-01-01", end="2024-06-30", interval="day",
)
print(df.head())
This needs your credentials and a network connection, so it is not run here, but the data it returns is the same date-indexed OHLCV table you already know how to handle.
Route two: an open-source library
When you do not have a broker account, or just want free historical data to practise on, an open-source library does the job. A widely used one is yfinance, which pulls historical prices at no cost. Indian instruments use an exchange suffix, so Reliance on the NSE is written RELIANCE.NS.
# Free, no account: the open-source yfinance library.
import yfinance as yf

df = yf.download("RELIANCE.NS", start="2024-01-01", end="2024-06-30")
print(df.head())
This too needs a network connection and is not run in the lesson. Open libraries are perfect for learning and research; for live trading data tied to your account, the broker SDK is the sturdier choice.
The shape is what matters
Whichever route you use, the result is a DataFrame of dates and OHLCV columns, exactly the structure from the loading chapter, so everything you learn to do next works the same regardless of where the data came from. To keep this course runnable without your credentials or a connection, the examples load a saved sample that has that identical shape.
# A real fetch (broker SDK or an open library) is shown in the chapter and needs
# your own setup. Here we load a saved sample so the course runs offline; a fetch
# returns data in exactly this shape.
import pandas as pd

df = pd.read_csv("sample_prices.csv", parse_dates=["Date"], index_col="Date")

print("Rows:", len(df), "| Columns:", list(df.columns))
print(df[["Open", "High", "Low", "Close", "Volume"]].head(3))Rows: 180 | Columns: ['Open', 'High', 'Low', 'Close', 'Volume']
Open High Low Close Volume
Date
2024-01-01 1406.26 1411.83 1401.56 1408.90 52573
2024-01-02 1410.76 1419.41 1400.77 1407.13 85367
2024-01-03 1423.20 1423.82 1415.62 1418.63 287804The output shows 180 rows and the five OHLCV columns, the same shape either fetch would deliver. When you run this for real, you simply replace the sample load with one of the fetch calls above.
The practicalities
Real data sources have quirks worth anticipating. They impose rate limits, so a program that requests too much too fast is throttled or blocked, which means you fetch sensibly and cache what you get rather than re-downloading. Data has gaps: weekends, holidays, and trading halts leave no rows, and a symbol may have missing days, which the cleaning chapter handles. Prices may be adjusted for splits and dividends or not, and mixing adjusted and unadjusted prices quietly corrupts a return calculation, so know which your source gives. And always respect the terms of use of whatever source you rely on. None of this is hard, but knowing it in advance saves a great deal of confusion later.
What to carry forward
You can fetch real OHLCV data on demand: the preferred route is your broker's official Python SDK, authenticated and tied to your account, and the free route is an open-source library like yfinance for historical prices, with Indian tickers carrying an exchange suffix. Both return the same date-indexed table, so downstream code does not care which you used, and the course uses a saved sample of that shape to run offline. Mind the practicalities, rate limits, gaps, and adjusted prices.
Real fetched data is rarely perfectly clean. The next chapter inspects and cleans a dataset, checking its shape, its types, and its missing values, before you compute anything on it.