Course contents
Telling signal from noise
The central problem of quant research is separating a real, repeatable signal from random noise, and markets are mostly noise. This chapter shows how much data it takes to be confident an effect is real, why a good-looking backtest is not the same as a statistically significant one, and how easily randomness imitates a pattern.
- Explain statistical significance and why a strong backtest is not proof of an edge
- Estimate how much data an effect needs before it can be trusted
- Recognise how readily random data produces convincing patterns
Markets are mostly noise with a little signal buried in them, and the quant's whole task is to tell the two apart. The previous chapter showed that a real edge can hide in a single year of data. This chapter answers the natural next question with hard arithmetic: how much data does it actually take to be sure an edge is real, and the answer, for the small edges that are all anyone really finds, is sobering.
Random data loves to look like a pattern
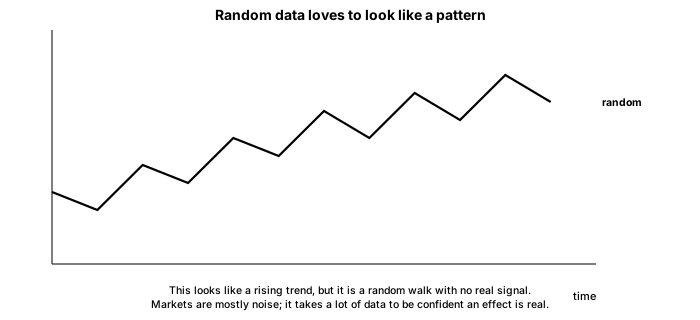
First, feel the size of the problem. Pure randomness is remarkably good at imitating patterns. A random walk, a price that moves by a coin flip each day, will produce trends, reversals, support levels, and head-and-shoulders shapes that look exactly like the ones traders point to on real charts. In the last chapter's funnel, random signals with no edge whatsoever still produced Sharpe ratios above 1 on half the data, purely by luck. The human eye and the eager backtester both see patterns everywhere, and most of those patterns are noise. This is not a flaw you can train away by looking harder. Looking harder finds more false patterns, not fewer.
The arithmetic of how much data you need
So how much evidence does it take to trust an edge? There is a clean way to estimate it. A strategy's t-statistic, roughly how many standard errors its return sits above zero, grows with its Sharpe ratio and the square root of the time you observe it: about the Sharpe times the square root of the number of years. To reach the usual bar of a t-statistic near 2, the years you need are about two divided by the Sharpe, squared. Put in real numbers.
# How much data does it take to be confident an edge is real, not noise? For a
# strategy with annual Sharpe S, the t-statistic after n years is about S * sqrt(n).
# A t-statistic near 2 is the usual bar for "probably not luck", so the years you
# need are about (2 / S) squared. Weaker edges need far more data.
import numpy as np

print("Annual Sharpe  ->  years of data to reach a t-stat of about 2:")
for sharpe in [2.0, 1.0, 0.5, 0.3]:
    years = (2 / sharpe) ** 2
    print(f"  Sharpe {sharpe:>4}:  about {years:5.1f} years")

# A quick check of the rule on a strong and a weak edge.
for sharpe in [1.0, 0.3]:
    years = (2 / sharpe) ** 2
    t_stat = sharpe * np.sqrt(years)
    print(f"\n  Sharpe {sharpe} over {years:.1f} years -> t-stat {t_stat:.1f}")

print("\nMost real edges have a Sharpe below 1, so they need many years to prove,")
print("and by then the market may have changed. This is why noise fools people:")
print("a few good months is nowhere near enough evidence to trust an edge.")Annual Sharpe -> years of data to reach a t-stat of about 2: Sharpe 2.0: about 1.0 years Sharpe 1.0: about 4.0 years Sharpe 0.5: about 16.0 years Sharpe 0.3: about 44.4 years Sharpe 1.0 over 4.0 years -> t-stat 2.0 Sharpe 0.3 over 44.4 years -> t-stat 2.0 Most real edges have a Sharpe below 1, so they need many years to prove, and by then the market may have changed. This is why noise fools people: a few good months is nowhere near enough evidence to trust an edge.
The table is the sobering heart of quant trading. A rare, excellent strategy with a Sharpe of 2 needs only about a year to prove itself. But a Sharpe of 1, already very good, needs four years. A Sharpe of 0.5, which is a perfectly respectable real edge, needs sixteen years of data. And a weak edge with a Sharpe of 0.3 needs over forty years. Since most genuine edges have Sharpes below 1, they need many years, sometimes decades, of data before the statistics can confirm them, and by then the market may well have changed and the edge decayed. This is the vice the quant lives in: the edges that are easy to confirm are almost never real, and the edges that might be real are almost impossible to confirm.
What this means in practice
Draw the practical lessons. A few good months, or even a couple of good years, is not evidence of an edge; it is consistent with pure luck around no edge at all. Be far more skeptical of a strong short-term result than a weak long-term one, because a high Sharpe over a short window is exactly what luck produces. Prefer edges you can observe over long histories and many independent instruments, because breadth buys you the sample size that time alone cannot. And hold every backtest, including the beautiful ones, against this arithmetic: ask not just what the Sharpe was, but whether the amount of data could possibly support believing it.
What to carry forward
Markets are mostly noise, and randomness is so good at imitating patterns that seeing one is barely evidence at all. The arithmetic is unforgiving: the data needed to confirm an edge grows as the square of one over its Sharpe, so the weak edges that are all anyone really finds need many years, even decades, to prove, by which time they may be gone. The lesson is to distrust strong short results, prefer long histories and broad tests, and always ask whether the data could support the claim. You now have the mindset, the process, and the statistics. The next part turns to the raw material all of it runs on, and the biases hidden in it: data.