Course contents
Ranking the whole market
The core quant idea is the factor: a measurable characteristic by which you can rank every stock, buying the top and avoiding or shorting the bottom, betting on the characteristic rather than on any one company. This chapter introduces cross-sectional thinking and grounds it in the NSE factor indices that already package these ideas in India.
- Define a factor and cross-sectional ranking
- Explain the long and long-short expressions of a factor
- Connect the idea to the NSE factor indices (momentum, quality, value, low volatility)
The single most productive idea in quantitative equity trading is the factor: instead of betting on one company, you bet on a characteristic shared by many. You rank the whole market by some measurable trait, buy the stocks at the top, and, if you can, short the ones at the bottom. You are no longer betting that one stock beats another; you are betting that cheap stocks beat expensive ones, on average, across dozens of names. This chapter introduces that way of thinking, and it is the foundation of the next four.
The cross-section
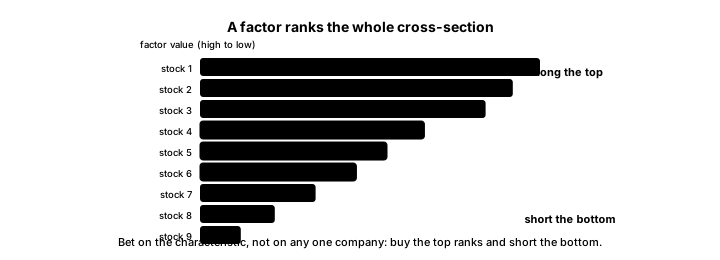
The word to learn is cross-sectional. A time-series view looks at one asset over time, the way most of Python for Trading did. A cross-sectional view looks across the whole section of the market at one moment, comparing many stocks to each other. A factor is a characteristic you can measure for every stock and rank them by: cheapness, recent return, financial quality, volatility, size. The bet is on the ranking, spread across many names, so no single company's fate matters much. That diversification across the cross-section is what turns a fragile single-stock hunch into something a quant can measure.
Building a factor: the long-short
The cleanest way to isolate a factor is a long-short portfolio: go long the top of the ranking and short the bottom. Here is the value factor, built that way.
# A factor is a ranking of the whole market. Here we build the classic VALUE
# factor: each month, go long the cheapest 20% of stocks by earnings yield and
# short the priciest 20%, held one month, rebalanced monthly. The result is the
# factor's long-short return. The data is synthetic and illustrative (factor_data.py).
import pandas as pd
from factor_data import make_market, long_short, annual_sharpe

returns, static = make_market()
n_months = len(returns)

# The value score (earnings yield) is a static characteristic here, so we use the
# same score every month. High earnings yield means a cheap stock.
value_score = pd.DataFrame([static["earnings_yield"].values] * n_months,
                           columns=returns.columns, index=returns.index)

ls = long_short(value_score, returns, quantile=0.2)

print(f"Universe: {returns.shape[1]} stocks, {n_months} months")
print("Value factor (long cheapest 20%, short priciest 20%, rebalanced monthly):")
print(f"  average monthly return: {ls.mean() * 100:.2f}%")
print(f"  annualised Sharpe:      {annual_sharpe(ls):.2f}")
print("\nA factor turns a whole market into one number per month: the return of")
print("betting on a characteristic. Every strategy in this part is a factor like this.")
print("These are illustrative synthetic results; real factor premia are smaller and noisier.")Universe: 60 stocks, 72 months Value factor (long cheapest 20%, short priciest 20%, rebalanced monthly): average monthly return: 1.28% annualised Sharpe: 1.22 A factor turns a whole market into one number per month: the return of betting on a characteristic. Every strategy in this part is a factor like this. These are illustrative synthetic results; real factor premia are smaller and noisier.
Each month, the strategy ranks the universe by earnings yield, buys the cheapest fifth, shorts the priciest fifth, and rebalances. The result is a single monthly return series, the factor's return, with a Sharpe of 1.22 in this illustrative data. Shorting the bottom is what isolates the factor: it cancels out the market's general move, leaving only the effect of the characteristic you ranked on. A long-only version, owning the top and skipping the short, is what most real products do, and it carries the market's ups and downs plus the factor tilt. Either way, the strategy is a rule for ranking the cross-section, not a view on any one stock. These results are synthetic and illustrative; real factor premia are smaller and far noisier, which is Part 4's subject.
India's factors: the NSE indices
This is not an academic idea in India. The National Stock Exchange publishes factor indices for exactly these characteristics, momentum, quality, value, and low volatility, along with multi-factor blends, and dozens of index funds and exchange-traded funds track them. So the cross-sectional factor is the most accessible real quant idea available to an Indian investor: you can gain disciplined exposure to a factor through a low-cost fund without ever running a long-short book, which is where this course lands in its final part. The exact indices and their recent performance are details to confirm at publish, and no factor is a guaranteed winner, but the toolkit the next chapters build is the one behind those real products.
What to carry forward
A factor is the central quant idea: a measurable characteristic by which you rank the whole cross-section of the market, betting on the ranking, long the top and often short the bottom, so no single company's fate dominates. The long-short form isolates the factor by cancelling the market's move, while long-only products carry the market plus the tilt. India's NSE factor indices and the funds tracking them make this the most accessible real quant approach for an individual. The next four chapters build the specific factors behind those indices, starting with the one with the most evidence and the ugliest failures: momentum.