Course contents
Enough statistics to not fool yourself
You cannot judge an edge without the basic tools of probability: distributions, the mean and variance, sampling, and the standard error that tells you how much a result might be luck. This chapter teaches exactly that much, in plain terms with code, so the rest of the course has the vocabulary to separate a finding from a fluke.
- Use distributions, mean, variance, and standard deviation to describe returns
- Explain sampling and standard error as the size of luck in a result
- Read a result together with its uncertainty rather than alone
You cannot tell a real edge from luck without a little statistics, and luckily you need only a little. This chapter teaches the smallest set of ideas that lets you measure how much a result might be chance: the average and its spread, and the one concept that matters most, the standard error. Skip the rest of statistics if you like, but not this.
Describing returns: average and spread
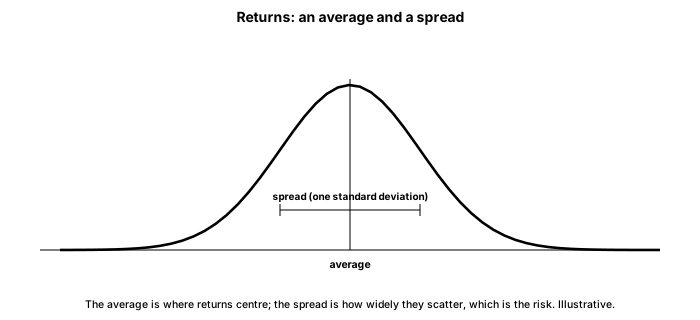
Start with two numbers that summarise any set of returns. The mean, the plain average, tells you the centre: what a typical period returned. The standard deviation tells you the spread: how far returns typically stray from that centre, which is exactly what we call volatility and treat as risk. A strategy returning 1% a month on average with a 2% standard deviation is a very different thing from one returning 1% with a 0.5% standard deviation, even though their averages match, because the second is far steadier. Every judgement of an edge starts with these two numbers, the return and the risk around it.
The idea that saves you: standard error
Here is the concept that separates people who fool themselves from people who do not. When you compute an average return from data, that average is only an estimate, drawn from a limited sample, and it comes with uncertainty. The standard error measures that uncertainty: it is how much your estimated average would wobble if you drew a different sample. It shrinks as you get more data, in proportion to the square root of the sample size, which is why more data makes an estimate more trustworthy. Around the estimate you can draw a confidence interval, a range that plausibly contains the true value. And the killer question for any edge is simple: does that range include zero? Watch.
# The most important idea in statistics for a trader: a result comes with
# uncertainty, and the standard error measures it. Here we estimate a strategy's
# average daily return and ask how sure we can be that it is not simply zero.
import numpy as np
from scipy import stats

rng = np.random.default_rng(1)
# 252 daily returns of a strategy with a TINY real edge of 0.02% per day, buried
# in daily noise of 1%. The edge is real, but the noise dwarfs it.
true_edge = 0.0002
daily = true_edge + rng.normal(0, 0.01, 252)

mean = daily.mean()
se = daily.std(ddof=1) / np.sqrt(len(daily))       # standard error of the mean
t_stat = mean / se
p_value = 2 * (1 - stats.t.cdf(abs(t_stat), df=len(daily) - 1))
ci_low, ci_high = mean - 1.96 * se, mean + 1.96 * se

print(f"Sample size:                    {len(daily)} days")
print(f"Estimated average daily return: {mean * 100:.4f}%")
print(f"Standard error of that mean:    {se * 100:.4f}%")
print(f"95% confidence interval:        [{ci_low * 100:.4f}%, {ci_high * 100:.4f}%]")
print(f"t-statistic {t_stat:.2f}, p-value {p_value:.2f}")

if ci_low <= 0 <= ci_high:
    print("\nThe interval includes zero. On one year of data we CANNOT rule out")
print("that this strategy has no edge at all, even though a real edge exists.")Sample size: 252 days Estimated average daily return: -0.0792% Standard error of that mean: 0.0578% 95% confidence interval: [-0.1925%, 0.0340%] t-statistic -1.37, p-value 0.17 The interval includes zero. On one year of data we CANNOT rule out that this strategy has no edge at all, even though a real edge exists.
Read this carefully, because it is humbling. The strategy has a real, positive edge built in, a true 0.02% a day. Yet estimated from one year of data, the average daily return comes out negative, at minus 0.08%, and its 95% confidence interval runs from minus 0.19% to plus 0.03%. That interval includes zero, and includes negative values, so on this year of data you could not even be sure the strategy makes money, let alone measure by how much. The edge is real and the data still cannot see it, because the daily noise, a 1% standard deviation, is fifty times the size of the daily edge. This is the normal situation in trading, not a trick, and it is why a single year of results proves almost nothing.
Significance, and its trap
Statisticians put a label on "probably not just luck": statistical significance, usually a p-value below 0.05, meaning a result this strong would occur by chance less than five times in a hundred if there were no real effect. It is a useful bar, and the example's p-value of 0.17 fails it, correctly telling us the year of data is not convincing. But hold significance loosely, for a reason the later chapters make sharp: if you test many strategies, some will clear the significance bar by pure chance, and significance found after much searching is not significance at all. For now, take the humble half of the lesson: a result you cannot distinguish from zero is not an edge, and most short backtests cannot be distinguished from zero.
What to carry forward
The smallest statistics that keep you honest are the mean and standard deviation, which describe a strategy's return and its risk, and above all the standard error, which measures how uncertain an estimated average is and shrinks with the square root of the sample size. Put a confidence interval around any edge and ask if it includes zero, and you saw a genuinely positive edge produce a negative, zero-spanning estimate over a whole year, because noise dwarfed it. Statistical significance is a useful bar to be held loosely, since searching defeats it. The next chapter turns this into the central quant question: how much data does it actually take to tell a signal from noise?