Course contents
Buying the winners
Momentum, the tendency of recent winners to keep winning for a while, is the most documented factor and the basis of the NSE momentum index. This chapter builds a simple momentum rank, explains the behavioural story behind it and the brutal crashes it suffers when trends reverse, and tests it honestly.
- Construct a cross-sectional and a time-series momentum signal
- Explain why momentum has historically worked and how it crashes
- Evaluate a momentum portfolio with risk-adjusted metrics
If one factor has the most evidence behind it across markets and decades, it is momentum: the tendency of recent winners to keep winning and recent losers to keep losing, for a while. It is also the factor with the ugliest failures. Momentum is the basis of the NSE's momentum index and the purest example of a behaviour-driven edge, and it repays understanding both its persistence and its crashes.
Building momentum
The momentum factor ranks stocks by their recent past return and bets that the ranking persists.
# The MOMENTUM factor: buy recent winners, sell recent losers. Each month we rank
# stocks by their trailing 12-month return, shifted so month t uses only returns up
# to t-1 (no lookahead), go long the top 20% and short the bottom 20%, held one
# month. Synthetic, illustrative data (factor_data.py).
import numpy as np
from factor_data import make_market, long_short, annual_sharpe, max_drawdown

returns, static = make_market()

# Trailing 12-month return, known at the start of each month.
momentum = (1 + returns).rolling(12).apply(np.prod, raw=True).shift(1) - 1
ls = long_short(momentum, returns, quantile=0.2)

print(f"Momentum factor (long winners, short losers, monthly), {len(ls)} months:")
print(f"  average monthly return: {ls.mean() * 100:.2f}%")
print(f"  annualised Sharpe:      {annual_sharpe(ls):.2f}")
print(f"  maximum drawdown:       {max_drawdown(ls) * 100:.1f}%")
print("\nMomentum has paid over long periods, but in real markets it also suffers")
print("rare, violent crashes when trends sharply reverse (a sudden market rebound")
print("after a fall is the classic one), which steady synthetic data cannot show.")
print("Those crashes are momentum's defining risk.")Momentum factor (long winners, short losers, monthly), 60 months: average monthly return: 1.32% annualised Sharpe: 0.98 maximum drawdown: -15.9% Momentum has paid over long periods, but in real markets it also suffers rare, violent crashes when trends sharply reverse (a sudden market rebound after a fall is the classic one), which steady synthetic data cannot show. Those crashes are momentum's defining risk.
Each month, the strategy ranks stocks by their trailing twelve-month return, buys the top fifth, shorts the bottom fifth, and holds for the month. A detail matters: the ranking uses returns known at the start of the month, never including the month you are about to trade, or you would be peeking at the future. The illustrative result is a Sharpe near 1. This same idea appears as cross-sectional momentum, comparing stocks to each other as here, and as time-series momentum, judging each asset against its own past, and both have long track records across markets and asset classes.
Why it works
No one is certain why momentum persists, which is a reason to hold it humbly, but the leading explanations are behavioural and connect to the Risk and Psychology course. Investors under-react to good news, so a rising stock keeps rising as the news sinks in. They herd, piling into what is already going up. And the disposition effect, selling winners too early, leaves winners underpriced for a while. These are the same human patterns that course described, now expressed as a tradable tilt. That momentum shows up so widely, across countries, centuries, and asset classes, is strong evidence it is more than a fluke, even without a settled theory.
The crashes
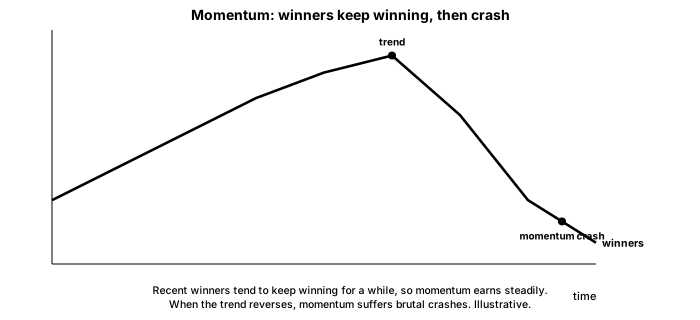
Momentum's dark side is severe, and it is the whole reason not to trade it naively. Momentum works until it violently does not. Its worst losses come at sharp reversals: after a market has fallen hard and then rebounds, the beaten-down losers that momentum is short scream upward while the winners it is long stall, and the strategy loses badly and fast. These momentum crashes are rare, sudden, and brutal, and the steady synthetic data here cannot show them, which is exactly why the honest warning has to be stated in words. Real momentum strategies pair the factor with defensive factors or a volatility control precisely to survive these crashes. A momentum edge without crash protection is an edge that eventually gives back years of gains in weeks.
What to carry forward
Momentum, buying recent winners and shorting recent losers on a trailing-return ranking, is the most documented factor and the basis of the NSE momentum index, with a behavioural story of under-reaction, herding, and the disposition effect behind it. Its edge is real enough to appear across markets and centuries, but its defining risk is the momentum crash: at sharp reversals it loses violently and fast, a danger no steady backtest reveals, so it is paired with defensive factors or volatility control. The next chapter turns to two factors that pull in opposite directions and pair beautifully: value and quality.