Course contents
How much the business earned
The income statement runs from revenue down to net profit, subtracting costs, interest, and tax along the way. The gaps between those lines, the margins, tell you how profitable the business really is.
- Read an income statement from revenue to net profit with an Indian example
- Define gross, operating (EBITDA and EBIT), and net margins
- Explain what each margin reveals about the business
When the news says a company posted a profit of some thousands of crore, it is quoting one line from the income statement, the very bottom one. But that single figure is the end of a journey that starts far higher up, at the company's sales, and the story of what happened between the two is where the income statement earns its keep.
From revenue to profit, line by line
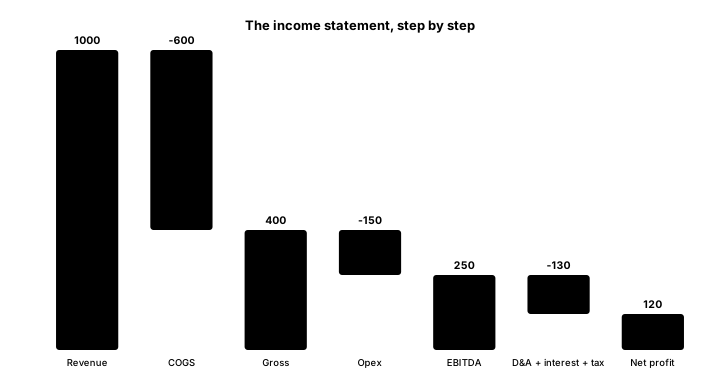
The income statement is a staircase from the top line to the bottom line, and each step subtracts a kind of cost. Follow our illustrative manufacturer down it (figures in crore rupees, illustrative).
At the top is revenue, also called sales or the top line: the total value of goods or services the company sold during the year. For our company, 1,000.
Subtract the cost of goods sold, or COGS, the direct cost of making what was sold, such as raw materials and factory labour. That leaves the gross profit. Our company: 1,000 minus 600 of COGS is a gross profit of 400.
Subtract the other operating costs of running the business, such as salaries, marketing, and administration. Before counting one non-cash charge, this leaves a widely watched figure called EBITDA, earnings before interest, tax, depreciation, and amortisation, a rough measure of the cash the core operations throw off. Our company: 400 minus 150 of these costs is an EBITDA of 250.
Now subtract depreciation and amortisation, the accounting charge that spreads the cost of a long-lived asset, a machine, say, over the years it is used. It is a real cost but not a cash payment this year. That leaves EBIT, earnings before interest and tax, also called operating profit, the profit from the actual business before financing and tax. Our company: 250 minus 50 is an EBIT of 200.
Subtract interest, the cost of the company's debt. That leaves profit before tax. Our company: 200 minus 40 of interest is 160.
Finally subtract tax. What remains is the net profit, also called profit after tax or PAT, the bottom line the news quotes. Our company, taxed at 25%, pays 40 and is left with a net profit of 120.
Margins: the same profit, in proportion
The rupee figures depend on the company's size, so to judge and compare profitability you turn each profit into a margin, the profit as a percentage of revenue. Our company earns a gross margin of 400 on 1,000, or 40%; an EBITDA margin of 25%; an operating margin of 20%; and a net margin of 120 on 1,000, or 12%.
Margins tell you what kind of business you are looking at. A consumer-goods maker with a strong brand, an FMCG company, might earn very high gross and net margins because people pay up for the brand. A commodity producer, a steelmaker selling a product no different from its rivals', might earn thin margins that swing with prices. Neither is good or bad in itself, but comparing a company's margins with its own history and with its direct competitors tells you whether its profitability is strong, improving, or slipping.
Your slice: earnings per share
One more figure comes straight off the income statement and matters to you as a part-owner. Divide the net profit by the number of shares, and you get the earnings per share, or EPS, the profit attributable to each share you own. Our company earns 120 crore of net profit on 10 crore shares, an EPS of 12 rupees. EPS is the link between the company's total profit and your single share, and it feeds directly into the valuation ratios of the next part.
Read the trend, not the year
The bottom line invites a lazy habit: judging a company by a single year's profit, or worse, a single quarter's. Resist it. One year can be flattered by a one-off gain, the sale of a building, say, or dented by a one-off cost, and depreciation and other charges rest on accounting judgement. What matters is the trend over several years and the quality of the profit: is revenue growing, are margins steady or improving, and is the profit backed by actual cash, which the cash flow statement will tell you. A single large profit figure means little on its own.
What to carry forward
The income statement is a staircase from revenue down to net profit, subtracting COGS to reach gross profit, operating costs to reach EBITDA and operating profit, and interest and tax to reach the bottom line, with margins turning each into a comparable percentage and EPS turning the total into your per-share slice. Judge it by the multi-year trend and the quality of the profit, not one headline figure.
The income statement covers a stretch of time. The next chapter freezes the company on a single day, to see what it owns and what it owes: the balance sheet.