Course contents
The fill you get is not the fill you tested
A backtest assumes you trade at the price on the screen; live, you trade at a slightly worse one, and that gap, slippage, quietly eats returns. This chapter models slippage and shows a thin edge shrink or vanish once realistic fills are assumed. Slippage is why many strategies that look good in a backtest are not.
- Define slippage and market impact and their sources (spread, size, speed)
- Add a slippage model to a strategy and measure the effect on returns
- Explain why frequent, small-edge strategies are the most exposed to slippage
Your backtest bought at 1,400 because that was the price on the screen. Live, you would have bought at 1,400.50, or 1,401, because by the time your order reached the market the best offer had moved, or your own order pushed it. That small difference between the price you expected and the price you got is called slippage, and it is one of the main reasons a strategy that looked good in a backtest disappoints in real life. This chapter measures it.
What slippage is, and where it comes from
Slippage is the gap between the price you based your decision on and the price you actually fill at. It comes from a few places. There is the bid-ask spread: you buy at the higher offer and sell at the lower bid, so you cross a small gap on every round trip. There is your own size, the market impact from the earlier chapter, where a large order moves the price as it fills. And there is delay: in the moment between your program deciding and the order arriving, the price can move, especially in a fast market. A backtest, working from a single price per bar, sees none of this. It fills the whole order at one clean number that no real trade ever gets.
A thin edge does not survive it
Whether slippage matters depends on how much edge a strategy has per trade and how often it trades. Slippage is a fixed toll paid every time you trade, so a strategy with a fat edge and few trades barely notices it, while one with a thin edge and many trades can be destroyed by it. Here are two such strategies, and what a rising slippage does to each.
# Slippage is a tax paid on every trade: the fill you get is a little worse than
# the price you saw. Whether a strategy survives it depends on its edge per trade
# and how often it trades. Here are two illustrative strategies, a patient one with
# a fat edge and few trades, and a frequent one with a thin edge and many trades.
# Net return per year = (edge per trade - slippage per trade) * trades per year.
import matplotlib
matplotlib.use("Agg")                       # save a file, do not open a window
import matplotlib.pyplot as plt

patient = {"edge": 0.005, "trades": 40, "label": "patient: 0.50% edge, 40 trades/yr"}
frequent = {"edge": 0.001, "trades": 500, "label": "frequent: 0.10% edge, 500 trades/yr"}

slippages = [i / 10000 for i in range(0, 61, 5)]     # 0.00% to 0.60% per trade

plt.figure(figsize=(7, 4.5))
for strat in (patient, frequent):
    net = [(strat["edge"] - s) * strat["trades"] * 100 for s in slippages]
    plt.plot([s * 100 for s in slippages], net, marker="o", label=strat["label"])
    print(f"{strat['label']}")
    print(f"  breaks even when slippage reaches {strat['edge'] * 100:.2f}% per trade")
    print(f"  net at 0.10% slippage: {(strat['edge'] - 0.001) * strat['trades'] * 100:+.0f}% per year")

plt.axhline(0, color="grey", linewidth=0.8)
plt.title("Slippage kills a thin edge first")
plt.xlabel("Slippage per trade (%)")
plt.ylabel("Net return per year (%)")
plt.legend()
plt.tight_layout()
plt.savefig("slippage_effect.png", dpi=110)
print("\nThe frequent strategy's edge is thinner, so a smaller slippage wipes it out,")
print("and because it trades so often, the damage past that point is severe.")
print("Saved slippage_effect.png")patient: 0.50% edge, 40 trades/yr breaks even when slippage reaches 0.50% per trade net at 0.10% slippage: +16% per year frequent: 0.10% edge, 500 trades/yr breaks even when slippage reaches 0.10% per trade net at 0.10% slippage: +0% per year The frequent strategy's edge is thinner, so a smaller slippage wipes it out, and because it trades so often, the damage past that point is severe. Saved slippage_effect.png
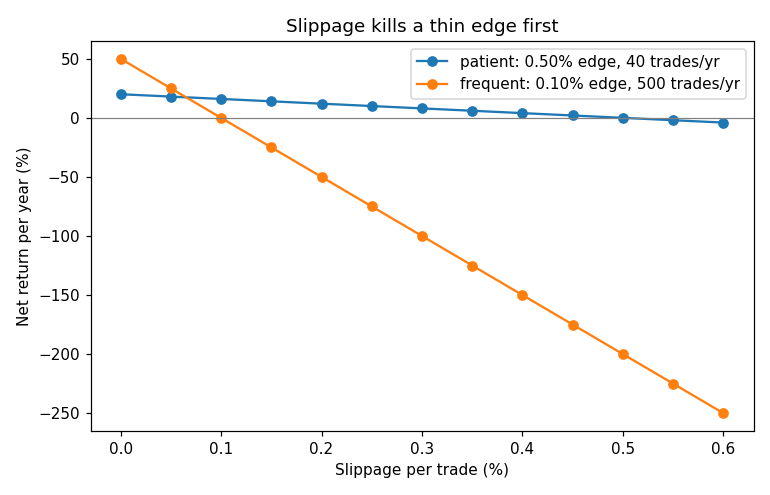
Read the two lines. The patient strategy earns 0.50% of edge per trade and trades 40 times a year, so it keeps most of its return until slippage climbs near 0.50% per trade, a level you would rarely see. The frequent strategy earns only 0.10% per trade but trades 500 times a year, and it breaks even the moment slippage reaches 0.10%, then falls off a cliff, because every one of those 500 trades pays the toll. This is the general law: a strategy's edge per trade must comfortably exceed its slippage per trade, and the high-frequency strategies that look most impressive in a backtest, with their many small profits, are exactly the ones a realistic slippage erases.
Model slippage before you believe a backtest
The practical lesson is to never trust a backtest that fills at the exact price. Add a slippage assumption to every backtest, a realistic penalty on each fill, and see whether the strategy survives it. The simulated broker in this course has a slippage setting for exactly this reason. A strategy that is only profitable when it fills at the perfect price is not profitable, because you will never get the perfect price. Better to assume too much slippage and be pleasantly surprised than to assume none and go broke on the difference.
What to carry forward
Slippage is the difference between the price your strategy decided on and the price it actually fills at, and it comes from the spread, your own market impact, and the delay before your order lands. A backtest that fills at one clean price per bar ignores all of it, which is why live results fall short. You saw that slippage is a per-trade toll: a patient, fat-edge strategy tolerates it, while a frequent, thin-edge one is wiped out as soon as slippage approaches its small edge. Always add a realistic slippage penalty to a backtest before trusting it. The next chapter looks at the one arena where speed dominates completely, and where retail simply cannot compete: the latency race.