Course contents
Why the backtest was too good
The single most common reason a live strategy underperforms its backtest is that the backtest was overfitted, tuned to the past so well it captured noise. This chapter revisits curve-fitting from Python for Trading and adds the professional's defence, out-of-sample and walk-forward testing, with a tested example that shows an in-sample star decay out of sample.
- Explain overfitting and how out-of-sample and walk-forward testing expose it
- Demonstrate the in-sample to out-of-sample performance decay in code
- Account for regime change, that an edge can be real and still stop working
In Python for Trading you saw a small horror: searching through parameter combinations turned a strategy that honestly lost into one that showed a handsome profit, just by picking the settings that happened to fit the past best. That was overfitting, and it is the deepest reason live results fall short of backtests. A backtest that has been polished until it looks wonderful has usually just been fitted to the noise of one particular history, and noise does not repeat. This chapter shows how to catch it.
Overfitting is fitting the noise
Every price history is part real pattern and part random noise. When you tune a strategy by trying many settings and keeping the one with the best past return, you are fitting both, and because there is far more noise than pattern, you mostly fit the noise. The result looks brilliant on the data you tuned it on and falls apart on anything new, because the specific wiggles it learned to exploit were random and will not happen again. The more combinations you search, the worse this gets: search hard enough and you can find a great-looking strategy in pure randomness. Which is exactly the test that exposes it.
The test: does it work on data it has never seen
The defence professionals use is simple to state. Never judge a strategy on the data you tuned it on. Split your history in two. Tune on the first part, the in-sample period, and then test the chosen strategy, untouched, on the second part it has never seen, the out-of-sample period. If the edge is real, it shows up in both. If it was overfitting, it evaporates out of sample. To make the point unmistakable, here is that test run on pure random-walk data, which has no real edge at all.
# The honest test for overfitting. We build a long RANDOM-WALK price series, which
# by construction has NO real edge, then search many moving-average combinations
# for the one that looks best on the first half (in-sample). If in-sample success
# were real, it would carry to the second half (out-of-sample). On noise, it does
# not, and the scatter shows no relationship at all. That is overfitting.
import numpy as np
import pandas as pd
import matplotlib
matplotlib.use("Agg")
import matplotlib.pyplot as plt

rng = np.random.default_rng(42)                 # seeded, so the result is reproducible
n = 1000
daily = rng.normal(0, 0.01, n)                  # random daily returns, no drift, no edge
close = pd.Series(1000 * np.exp(np.cumsum(daily)))

half = n // 2
in_close = close.iloc[:half].reset_index(drop=True)
out_close = close.iloc[half:].reset_index(drop=True)
cost = 0.001


def total_return(closes, fast_n, slow_n):
    fast = closes.rolling(fast_n).mean()
    slow = closes.rolling(slow_n).mean()
    pos = (fast > slow).astype(int).shift(1).fillna(0)
    mkt = closes.pct_change().fillna(0)
    trade = pos.diff().abs().fillna(0)
    return (1 + (pos * mkt - trade * cost)).prod() - 1


combos = [(f, s) for f in range(5, 30, 2) for s in range(30, 80, 5) if f < s]
records = [(f, s, total_return(in_close, f, s) * 100, total_return(out_close, f, s) * 100)
           for f, s in combos]
best = max(records, key=lambda r: r[2])         # the curve-fitter picks the best in-sample

print(f"Searched {len(records)} combinations on random-walk data (no real edge).")
print(f"Best IN-SAMPLE combo: {best[0]}/{best[1]}")
print(f"  in-sample return:     {best[2]:6.2f}%   (looks like an edge)")
print(f"  out-of-sample return: {best[3]:6.2f}%   (it was noise)")

ins = [r[2] for r in records]
outs = [r[3] for r in records]
corr = np.corrcoef(ins, outs)[0, 1]
print(f"Correlation between in-sample and out-of-sample returns: {corr:+.2f}")

plt.figure(figsize=(6, 5))
plt.scatter(ins, outs, alpha=0.6)
plt.scatter([best[2]], [best[3]], color="red", zorder=5,
            label=f"best in-sample ({best[0]}/{best[1]})")
plt.axhline(0, color="grey", linewidth=0.8)
plt.axvline(0, color="grey", linewidth=0.8)
plt.title("In-sample success does not carry to out-of-sample")
plt.xlabel("In-sample return (%)")
plt.ylabel("Out-of-sample return (%)")
plt.legend()
plt.tight_layout()
plt.savefig("walk_forward.png", dpi=110)
print("Saved walk_forward.png")Searched 130 combinations on random-walk data (no real edge). Best IN-SAMPLE combo: 27/55 in-sample return: 2.88% (looks like an edge) out-of-sample return: -12.71% (it was noise) Correlation between in-sample and out-of-sample returns: +0.04 Saved walk_forward.png
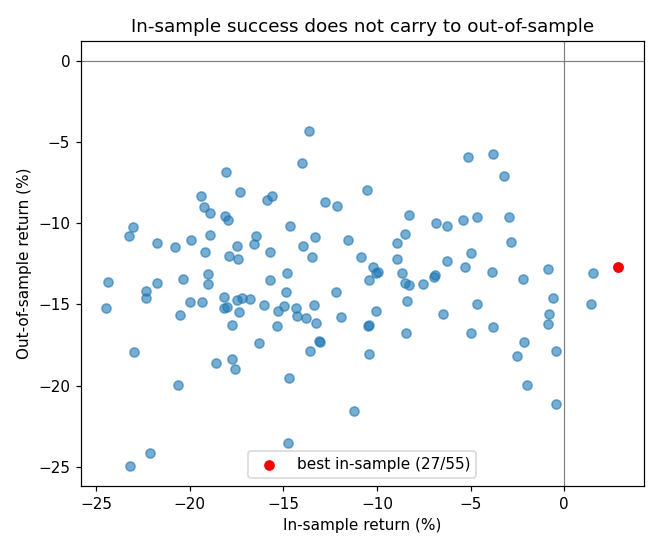
Read the result, because it is the whole lesson. On data that is by construction random, with no edge to find, searching 130 combinations still turned up a best in-sample strategy showing a positive 2.88%. It looks like an edge. It is not: on the out-of-sample half it lost 12.71%. And the scatter tells the deeper story. Across all 130 combinations, the in-sample return has essentially no relationship with the out-of-sample return, a correlation of almost zero. Knowing how well a setting did on the past told you nothing about how it would do next. That is overfitting laid bare: an impressive backtest, produced by searching noise, that predicts nothing.
Even a real edge can fade
There is a humbler cousin of overfitting worth naming: regime change. Markets are not a fixed system; they change. A strategy can capture a genuine pattern that really existed, trade it profitably for a while, and then quietly stop working because the conditions that produced the pattern have gone: volatility shifts, a rule changes, a behaviour that other traders have since competed away. This is not a mistake in your testing; it is the nature of markets. It is why even a well-tested, out-of-sample-validated strategy must be watched in the live results the final part builds, and retired when its edge is gone. No edge is forever.
What to carry forward
Overfitting is fitting a strategy to the random noise in past prices, and it is the deepest reason a live strategy underperforms its backtest: the wiggles it learned were random and do not repeat. The defence is out-of-sample testing, tune on one period and judge on a later, unseen one, and you saw why it matters when a search of pure random data produced a best in-sample strategy at plus 2.88% that lost 12.71% out of sample, with no relationship between in-sample and out-of-sample results at all. Beyond overfitting, even a genuine edge can fade as markets change, so live strategies must be watched and retired. Next, the concrete ways all of this goes wrong at speed: the catalogue of how an automated system blows up.